The year 2024 proved to be quite volatile for fixed income investors, as yields fell dramatically from their heights in 2023, then rose again in the fourth quarter (Q4), closing the year within a stone’s throw of the highest levels of the year. The rise in yields in Q4 was due, in large part, to uncertainty surrounding what a Trump presidency could mean for inflation and the economy. We also saw equity markets reach valuation levels that are among the highest in recorded history. In light of these extraordinary market conditions, we have provided a list below of the most important factors we believe municipal bond investors should consider as they seek to navigate this uncertainty over the next twelve months.
Broader municipal sector credit fundamentals remain steady
Substantial reserve balances amplified by unprecedented federal pandemic aid buffer against potential revenue disruption
Municipal sector is highly rated with positive ratings momentum since the onset of the pandemic
Upgrade-to-downgrade ratios have been strongly positive for 14-15 consecutive quarters through Q3 2024*
Municipal bond default rates remain well below 1% compared with 2.6% for corporates**
Vast majority of municipal defaults are unrated credits (approximately 87%***), a striking contrast to corporate defaults
Absolute municipal bond yields are compelling, particularly for investors in higher tax brackets. See chart below
For the month of December 2024, municipal bond yields rose sharply, albeit by a smaller magnitude than Treasuries:
The 10-year Treasury yield rose to 4.57% from 4.19%, or 38 basis points. The 10-year ‘AAA’ municipal bond yield moved to 3.04% from 2.76%, cheapening by 28 basis points. The 30-year MMD ‘AAA’ municipal bond yield moved to 3.90% from 3.59%, or 31 basis points
The 10-year municipal-to-treasury ratio was essentially unchanged. It started the month at 65.8% and moved to 66.7% using a federal tax rate of 39.6%
According to JP Morgan, Bloomberg’s Investment Grade Tax-Exempt Municipal Index recorded a total return of -1.46% in December, culminating in a full-year return of 1.05% for 2024. This full-year performance outpaced the UST Index (+0.58%)
2024 inflows into municipal bond funds were nearly $42 billion reflective of strong investor demand given yield, tax advantages, and diversification needs****
Municipal new-issue total supply was a record-high $504 billion in 2024. Supply is expected to remain solid in 2025, presenting a diverse investment opportunity set ****
December’s Personal Consumption Expenditures (PCE) Price Index, commonly referred to as core PCE, the Federal Reserve’s preferred measure of price changes, was below market consensus expectations (core PCE rose 2.8% year-over-year versus an expected 2.9%, while headline PCE inflation year-to-year was 2.4% versus an expected 2.5%). Continued moderating inflation should be favorable for the longer-term interest rate trajectory and fixed income investors
Data sources:
*JP Morgan
**S&P: “2023 Annual U.S. Corporate Default And Rating Transition Study”
***Charles Schwab
****LSEG Lipper data
Please remember that past performance may not be indicative of future results. Net-of-fee performance returns are calculated by deducting the actual Clinton Investment Management, LLC investment management fee from the gross returns. Performance returns include the reinvestment of income and capital gains. Actual results may differ from the composite results depending upon the size of the account, investment objectives, guidelines and restrictions, inception of the account and other factors. Different types of investments involve varying degrees of risk, and there can be no assurance that the future performance of any specific investment, investment strategy, or product, made reference to directly or indirectly in this newsletter (article), will be profitable, equal any corresponding indicated historical performance level(s), or be suitable for your portfolio. Due to various factors, including changing market conditions, the content may no longer be reflective of current opinions or positions. Moreover, you should not assume that any discussion or information contained in this newsletter (article) serves as the receipt of, or as a substitute for, personalized investment advice from Clinton Investment Management, LLC. To the extent that a reader has any questions regarding the applicability of any specific issue discussed above to his/her individual situation, he/she is encouraged to consult with the professional advisor of his/her choosing. Please consult with an investment professional before making any investment using content or implied content from any investment manager. A copy of our current written disclosure statement discussing our advisory services and fees is available upon request.
The views and opinions expressed are not necessarily those of the distributing firm or any affiliates. Nothing discussed or suggested should be construed as permission to supersede or circumvent your firm’s policies, procedures, rules, and guidelines.
Our CEO, Andrew Clinton, recently appeared on Asset TV in coordination with MMI to deliver a municipal bond masterclass.
Watch here to learn more about the municipal bond market and our current outlook.
Please remember that past performance may not be indicative of future results. Net-of-fee performance returns are calculated by deducting the actual Clinton Investment Management, LLC investment management fee from the gross returns. Performance returns include the reinvestment of income and capital gains. Actual results may differ from the composite results depending upon the size of the account, investment objectives, guidelines and restrictions, inception of the account and other factors. Different types of investments involve varying degrees of risk, and there can be no assurance that the future performance of any specific investment, investment strategy, or product, made reference to directly or indirectly in this newsletter (article), will be profitable, equal any corresponding indicated historical performance level(s), or be suitable for your portfolio. Due to various factors, including changing market conditions, the content may no longer be reflective of current opinions or positions. Moreover, you should not assume that any discussion or information contained in this newsletter (article) serves as the receipt of, or as a substitute for, personalized investment advice from Clinton Investment Management, LLC. To the extent that a reader has any questions regarding the applicability of any specific issue discussed above to his/her individual situation, he/she is encouraged to consult with the professional advisor of his/her choosing. Please consult with an investment professional before making any investment using content or implied content from any investment manager. A copy of our current written disclosure statement discussing our advisory services and fees is available upon request.
The views and opinions expressed are not necessarily those of the distributing firm or any affiliates. Nothing discussed or suggested should be construed as permission to supersede or circumvent your firm’s policies, procedures, rules, and guidelines.
There are applications for the uncertainty principle in modern finance.
Why would the Fed begin cutting interest rates aggressively if the economy was as strong as many have claimed? The answer to this question could be found in the election results themselves.
Why would the Fed be cutting rates if the US job market was strong? Perhaps the job market is also not strong, as evidenced by the substantial downward revisions in new jobs created over the past year, over -800k according to the Bureau of Labor Statistics and -110k jobs, just in the past two months, according to the October nonfarm payroll report.
Extending the Tax Cut and Jobs Act (TCJA) will be priority number one for the new administration. However, we also know that simply extending tax cuts, in their current form, will likely have very little economic impact, other than maintaining the status quo.
Revenue from tariffs is unlikely to be large enough to offset the deficit that will likely result from extending the TCJA. For those who have suggested that tariffs could result in a significant rise in inflation, once again, we caution this view, as goods represent only a small fraction of the broader US economy.
The S&P 500 now sits at record highs, at the second highest valuation in history, according to the CAPE ratio. It is also worth noting that both Vanguard and Goldman Sachs have recently published equity market research which concludes that returns for the S&P 500 are likely to be between 3% to 4%, per year, for the next decade. Perhaps this is why Warren Buffet, arguably the greatest investor in history, is now sitting on $325 billion in cash. That is the highest cash position Buffet has ever held in history, representing roughly a third of Berkshire Hathaway’s market capitalization.
A German physicist formulated the uncertainty principle of quantum physics in 1927. According to Caltech, “the uncertainty principle states that we cannot know both the position and speed of a particle, such as a photon or electron, with perfect accuracy.” That is to say, the more accurately we triangulate a particle’s position, the less we know about its speed and vice versa. This means that we may know the speed or location of an electron, but not both at the same time.
There are applications for the uncertainty principle in modern finance as well. While strategists may state, with high conviction, they know both the specific destination and timing of market movements, history has demonstrated otherwise. A view expressed through speculation and hope is not the same as a position taken through understanding and knowledge. For example, just a few months ago, many in the investing community posited that the Federal Reserve (Fed) would need to raise interest rates further to arrest inflation. Yet, in September, the Fed embarked on its next easing cycle, cutting rates by a substantial 0.50% or 50 basis points. Therefore, as we consider the dizzying news cycle of the past six weeks, including the impact of Donald Trump’s reelection, together with Republican control of Congress, we are reminded that political and business cycles are not the same thing. While we are extremely sensitive to a desire for certainty, following a contentious election cycle, we also know that the sausage making of governing often results in very different outcomes than one might expect. This is especially true when attempting to see months, if not years, beyond election night. While Republicans will control the executive and legislative branches of government, we do not yet know by what margin Republicans will control the House in particular. As of this moment, the balance of power in the House will likely continue to be narrow. Therefore, we need to consider a number of potential outcomes, from President-Elect Trump’s policy initiatives and the Federal Reserve’s actions, that may occur over the months and years ahead. We will do so with a healthy dose of modesty, given the highly uncertain nature of what may ultimately come to pass. We will also evaluate the essential diversifying role that fixed income plays in one’s asset allocation, and the significant benefits of the tax-free cash flow that municipal bonds deliver.
Let’s begin our discussion with a question. Why would the Fed begin cutting interest rates aggressively if the economy was as strong as many have claimed? The answer to this question could be found in the election results themselves. US exit polls clearly illustrated the primary issue that most influenced voting decisions on election night, was, in fact, the economy. Given the meaningful change in party control, across all three branches of government, one can presume that voters were extremely unhappy with the direction of the economy. The economy, therefore, may not be nearly as strong as the Fed and many in the financial services community would have us believe. Moreover, the Fed stated clearly, following its first rate cut in September, that it was pivoting away from focusing primarily on bringing down inflation, given inflation’s steady decline over the past two years. The Fed, instead, is now more focused on supporting the US jobs market by lowering interest rates. This raises yet another question. Why would the Fed be cutting rates if the US job market was strong? Perhaps the job market is also not strong, as evidenced by the substantial downward revisions in new jobs created over the past year, over -800k according to the Bureau of Labor Statistics and -110k jobs, just in the past two months, according to the October nonfarm payroll report. Given these concerns, we must vigilantly follow the unemployment data to determine if job losses are accelerating, as this could result in slowing economic growth over time.
We will also be following closely the degree to which President-Elect Trump fulfills the policy initiatives he laid out on the campaign trail. What we currently know is that extending the Tax Cut and Jobs Act (TCJA) will be priority number one for the new administration. However, we also know that simply extending tax cuts, in their current form, will have very little economic impact, other than maintaining the status quo. While Republicans appear to be in firm control of the Senate, it appears they have only a narrow majority in the House. Without a Republican super majority in Congress, passing significant tax reform will require Republicans to pass tax laws via budget reconciliation. Budget reconciliation requires that new laws that reduce revenues and thereby increase the deficit, such as tax cuts, need to be paid for through offsetting revenue generators. Therefore, a fundamental question facing the new President and Congress will be where to find additional revenue to pay for the extension of the existing tax regime. Some have suggested revenue will be found through the repeal of some, or all, of the Inflation Reduction and Chips Acts, as well as the rolling back of student loan forgiveness. The impact of this on the economy would likely be negative as government spending and additional discretionary spending from student loan forbearance contributed meaningfully to US GDP growth over the past four years. Some have even suggested that government spending was the primary factor keeping the US economy from slipping into recession during President Biden’s term. Research indicates several Republican-controlled states have deeply benefited from both the Inflation Reduction and Chips Acts, making a full repeal potentially unlikely. Having said that, we see deep cuts of this nature as a limiting factor on GDP growth going forward. It has also been suggested that tariffs could create revenue that could offset tax cuts. While true, it is important to note that the President has the authority to raise tariffs on goods, not services. Goods represent roughly 6% of GDP, according to Rosenberg Research. Therefore, revenue from tariffs is unlikely to be large enough to offset the deficit that will likely result from extending the TCJA. For those who have suggested that tariffs could result in a significant rise in inflation, once again, we caution this view, as goods represent only a small fraction of the broader US economy.
Economic conditions are also very different now, compared to Trump’s first term. First and foremost, we must recognize that when Trump took office in 2016, the economy was quite strong, the Fed was just beginning its rate hiking cycle, and tax rates had yet to be cut. This time, however, we are approaching the end of the business cycle, as evidenced by the sub 2.5% Atlanta Fed GDPNow estimate for Q4, while the Fed is just beginning to ease financial conditions by cutting interest rates.
We must also consider the degree to which risk markets have priced-in a significant degree of good news. The S&P 500 now sits at record highs, at the second highest valuation in history, according to the CAPE ratio. It is also worth noting that both Vanguard and Goldman Sachs have recently published equity market research which concludes that returns for the S&P 500 are likely to be between 3% to 4%, per year, for the next decade. Perhaps this is why Warren Buffet, arguably the greatest investor in history, is now sitting on $325 billion in cash. That is the highest cash position Buffet has ever held in history, representing roughly a third of Berkshire Hathaway’s market capitalization. Clearly a significant degree of good news has been pulled forward in current equity market valuations, in our view. This is extremely important as investors seek to achieve strong risk-adjusted returns going forward.
It is at moments like these, when outcomes are uncertain and risks are elevated, that we are reminded of the essential diversifying role that fixed income plays within one’s asset allocation. Fixed income provides a fixed source of cash flow and confidence, assuming underlying credit quality remains stable, as investors await further confirmation of the direction of the economy. The additional challenge investors face is that the yields on cash instruments are declining rapidly. The Fed has already cut interest rates by 0.75% or 75 basis points. This cut is likely already reflected in the lower yields investors now receive on preferred savings and money market instruments. The good news is that yields on fixed income instruments are among the highest they have been in 10-15 years. For example, municipal bonds offer yields of 3.5%-4% tax-free, in the longer- intermediate and longer-term areas of the municipal bond yield curve. For those in the highest tax-brackets, these tax-free yields equate to roughly +6% to +7% on a taxable equivalent basis (TEY). If one shares Vanguard and Goldman outlooks for expected returns of the S&P 500, municipal bonds offer almost double the expected return, just from the cash flow alone, on a TEY basis. It is also worth noting that equities are almost four times more volatile than munis, based on their historical standard deviation of returns, according to Barclays Fixed Income Research. Given that municipal credit quality remains quite strong and will remain stable, broadly speaking, we firmly believe munis will continue to be one of the best performing fixed income segments on a risk-adjusted basis, going forward.
As we look out over the last quarter of 2024 and into 2025, what we know with certainty is that the direction of financial markets, the broader economy, and the geopolitical landscape will remain highly uncertain. We are also humble enough to accept that the uncertainty principle can be instructive, especially in environments like these. As investors consider the potential treacherous crosscurrents of political policy implementation and potential economic outcomes, we recommend a heavy dose of caution when assessing the statements of those who claim to know both the timing and destination of broader market movements. We also know that sentiment has been the primary driver of market movement over the past several weeks, rather than fundamental economic data. As professional managers, we do not invest based on sentiment. On the contrary, our investment philosophy and process is foundationally constructed on the basis of seeking to deeply understand risk and determine whether investors are being compensated for that risk. In this regard, interest rates have risen by over 80 basis points since the Fed cut rates the first time in September, largely on speculation. Therefore, we believe the current level of tax-exempt yields are attractive as they do not reflect the low risk associated with municipal bonds. As our clients know, we would never recommend investors make rash decisions with respect to their asset allocations based on a singular event or data point. On the contrary, we continue to advise investors to derive their asset allocation decisions based on their long-term investment objectives, risk tolerance, and the ultimate length of their investment horizons. While administrations come and go, we know that uncertainty is a constant presence in our lives. Fixed income allocations enable investors to remain calm and ride out periods of market volatility that otherwise may force financial decisions that are suboptimal at best or, at worst, detrimental to achieving their goals.
If you should have any questions regarding this commentary or the municipal bond market more broadly, please do not hesitate to contact us directly.
Best Regards,
Andrew Clinton
CEO
Please remember that past performance may not be indicative of future results. Net-of-fee performance returns are calculated by deducting the actual Clinton Investment Management, LLC investment management fee from the gross returns. Performance returns include the reinvestment of income and capital gains. Actual results may differ from the composite results depending upon the size of the account, investment objectives, guidelines and restrictions, inception of the account and other factors. Different types of investments involve varying degrees of risk, and there can be no assurance that the future performance of any specific investment, investment strategy, or product, made reference to directly or indirectly in this newsletter (article), will be profitable, equal any corresponding indicated historical performance level(s), or be suitable for your portfolio. Due to various factors, including changing market conditions, the content may no longer be reflective of current opinions or positions. Moreover, you should not assume that any discussion or information contained in this newsletter (article) serves as the receipt of, or as a substitute for, personalized investment advice from Clinton Investment Management, LLC. To the extent that a reader has any questions regarding the applicability of any specific issue discussed above to his/her individual situation, he/she is encouraged to consult with the professional advisor of his/her choosing. Please consult with an investment professional before making any investment using content or implied content from any investment manager. A copy of our current written disclosure statement discussing our advisory services and fees is available upon request.
The views and opinions expressed are not necessarily those of the distributing firm or any affiliates. Nothing discussed or suggested should be construed as permission to supersede or circumvent your firm’s policies, procedures, rules, and guidelines.
When the Fed begins to cut interest rates, next month, as markets now expect, it will likely be the first of a series of cuts, rather an isolated event.
The extremely weak July payroll report triggered the Sahm Rule for the first time since the previous recession. The Sahm Rule is a statistical measure that has historically indicated when the US economy has entered recession. This condition has been correlated with recession 100% of the time, since 1970.
The first rate cut of an easing cycle will likely have the opposite effect of its intended purpose, that is the first cut will result in a “tightening” of financial conditions rather than an easing.
The outlook for fixed income investors, and municipal bond holders in particular, has improved meaningfully in recent weeks.
The best opportunities to achieve extremely attractive risk-adjusted returns, for individuals in the highest tax brackets, remain in the municipal bond market, in our view.
Whether moving from cash to maximize tax-free cash flow, or extending duration to capture greater total return as rates fall, the case for acting before the next leg down in rates begins, is an extremely compelling one, in our view.
Federal Reserve Chairman Powell stated, during his July Federal Open Market Committee press conference, that cutting interest rates is a process. This is extremely important as it implies that when the Fed begins to cut interest rates, next month, as markets now expect, it will likely be the first of a series of cuts, rather an isolated event. While many strategists and media pundits, throughout 2024, have posited that further rate “hikes” might be necessary, or at the very least, interest rates would need to stay “higher for longer,” we at Clinton Investment Management (CIM) have held firm to the view that rate cuts would begin in earnest very soon. Our conviction remains high due to the downward direction of a variety of economic indicators we closely follow. These include domestic and global inflation, weakening consumer spending, US economic activity, and rising unemployment over the past three months, just to name a few. The recent weak payroll data, together with falling consumer prices, reflected in the Fed’s preferred measure of inflation, Personal Consumption Expenditures (PCE), see Figure 1, appear to be indicating that the US economy is approaching an inflection point. The Treasury market reflects this reality and has priced in a near 100% likelihood that the Fed will begin cutting interest rates, as soon as September, to ease financial conditions to arrest the decline in economic activity that has begun.
The extremely weak July payroll report also triggered the Sahm Rule for the first time since the previous recession. The Sahm Rule is a statistical measure that has historically indicated when the US economy has entered recession. The rule identifies the inflection point at which the US unemployment rate rises by at least 0.5%, from its 12-month low, over the prior three months. This condition has been correlated with recession 100% of the time, since 1970. When Powell was asked specifically about the triggering of the Sahm Rule, in his July press conference, he attempted to allay concerns about recession, while at the same time describing the Sahm Rule as a “statistical regularity”. This characterization implies it is a reasonable expectation that this economic indicator will, once again, be accurate.
What should investors do with this new information? When considering likely outcomes over the next 12 to 18 months, we are reminded that the first rate cut of an easing cycle will likely have the opposite effect of its intended purpose, that is the first cut will result in a “tightening” of financial conditions rather than an easing. The reason for this seemingly contradictory outcome rests in the notion that the first cut is an extremely powerful signal to market participants and borrowers alike. The first cut is a unique and extraordinary statement to corporations, home buyers, car buyers, commercial property investors, and borrowers of all shapes and sizes, that the first cut is likely to be one of many. Once the cut is made, informed borrowers understandably conclude that future cuts will be forthcoming and, therefore, delay their borrowing needs in the hopes of achieving lower borrowing costs in the future. Incentivizing borrowers, corporations, and individuals to wait until lending and financial conditions ease or improve further, causes loan demand to fall, results in a cascading effect, triggering a further contraction in economic activity. This forces the Fed to cut more deeply to incentivize borrowers off the sidelines. This is why the Fed has been forced to reduce interest rates below the neutral rate of interest, R*, during prior recessions and easing cycles.
The notion of an economic soft-landing as the most likely outcome, whereby the economy avoids recession, is an unlikely outcome, in our view, especially when one considers the entirety of historical US economic outcomes and monetary policy. A soft landing has only been achieved on one occasion in history. In 1995 Fed Chairman Greenspan proactively cut interest rates as inflation fell. In contrast, Powell and this Fed have kept interest rates at the highest levels for almost a year, even as inflation has fallen by almost 80%. The Fed hasn’t even stopped winding down its balance sheet through Quantitative Tightening (QT). The Fed is tightening financial conditions each day it waits to act. Therefore, it is hard to see how the US economy escapes recession this cycle. We are sorry to say that this time is not likely to be different than cycles of the past, regardless of how much we may hope that was not the case.
Therefore, the outlook for fixed income investors, and municipal bond holders in particular, has improved meaningfully in recent weeks. Inflation continues to fall as evidenced by further declines in the Consumer Price Index (CPI), Producer Price Indices (PPI), as well as the Fed’s preferred measure of inflation, PCE. The softening of economic projections has caused long-term interest rates to fall meaningfully. Since the peak in interest rates in October of 2023, Treasury yields have declined by over 1.10% or 110 basis points. For investors who were waiting to see if rates would stop rising, we can say with confidence that that moment has passed.
As our clients and readers know, we have been recommending, for some time, that investors prepare for lower rates by proactively locking in higher yields in longer-term bonds, before rates fall further. Doing so would provide higher cash flow for investors as short-term rates decline, as the Fed embarks on the next easing cycle, while longer-duration securities can be expected to deliver higher total rates of return over time. In general, investors who followed this advice over the past year have been rewarded as bond prices have risen while rates fell. Investors who may have chosen to wait to act can take comfort as rates have much further to fall, in our view.
Chair Powell stated in his recent press conference, assuming economic data continues on its downward path, the Fed will begin “normalizing” interest rates very soon. The question remains. What does interest rate normalization look like? We are pleased to share that the Fed has already told us what to expect. The normalized level of the Fed Funds rate, that is neither expansionary or contractionary, better known as the Fed’s neutral rate or R*, is somewhere between 2.00% and 2.75%. Given that the Fed Funds rate is currently 5.25%-5.5%, this means the Fed is likely to cut interest rates by over -200 to -300 basis points before the end of the easing cycle. This outcome is not priced into bond yields or prices at present, in our view, which means bonds are attractively valued. We are, therefore, compelling investors to move deliberately, in the near term, to extend out of cash instruments and short-duration bonds, before those yields fall further, as they are likely to, in the coming weeks and months. The level of reinvestment rate risk in cash and preferred savings/money market instruments is now the highest it’s been since prior to the global pandemic.
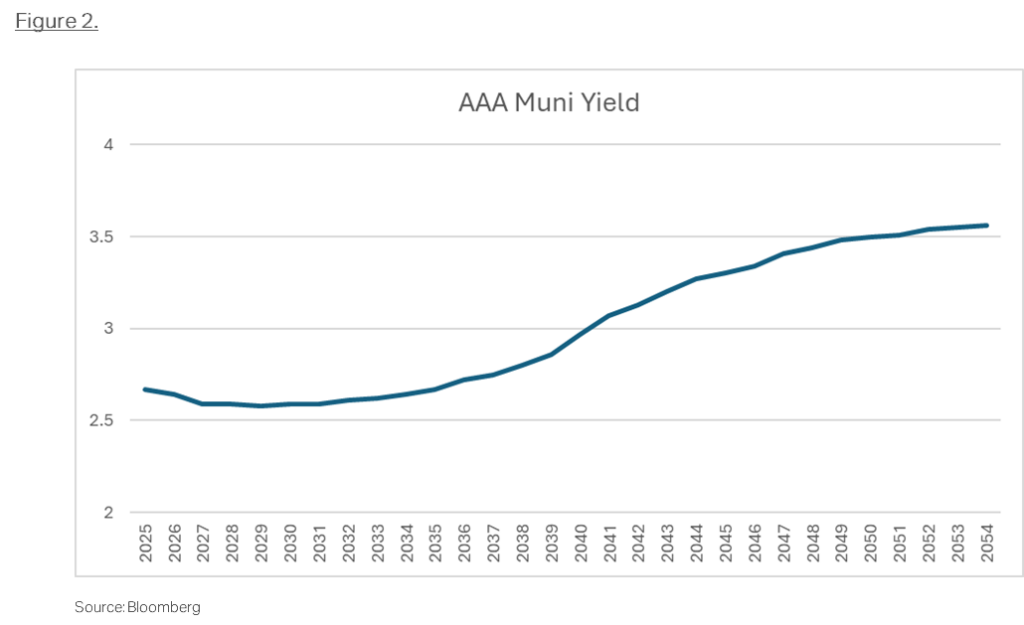
The best opportunities to achieve extremely attractive risk-adjusted returns, for individuals in the highest tax brackets, remain in the municipal bond market, in our view. While the short end of the muni curve remains inverted, see Figure 2, the long end of the curve remains steeply sloped, providing investors with the opportunity to both increase yield and extend duration, to take advantage of the falling interest rate environment we expect going forward.
Municipal credit quality remains stable, while upgrades continue to outnumber downgrades by a healthy margin, providing confidence that municipal credit quality should remain stable even in the face of slowing US economic growth. Even if the upgrade to downgrade ratio weakens from current levels, the municipal bond default rate is extremely low, even during downturns. Corporate bond default rates are materially higher across all rating buckets. Municipal bonds continue to offer attractive returns from yield alone, with substantially lower risk/standard deviation of returns as compared to the broader equity markets. Therefore, given our outlook, we believe the total return opportunity in longer intermediate and longer duration municipal bonds is particularly compelling, over the next 12 to 24 months.
As we approach the back half of the year, we firmly believe the best of days for this business cycle are behind us. Whether the US economy is already in recession, as the Sahm Rule indicates, or the economy enters recession in the months ahead is not our greatest concern. More concerning is the knowledge that many investors are largely unprepared for what is likely to come next. The high levels of reinvestment rate risk embedded in cash and cash-like instruments, whose yields are likely to fall precipitously going forward, offer little compensation to investors who delay action. We firmly believe that this is not the moment to be complacent. We have seen, in the prior weeks and months, just how quickly interest rates can fall. While it took months, if not years, for rates to rise to their current levels, we know that, at times, rates can fall dramatically in a matter of seconds, when the market eventually perceives that the current business cycle has officially ended. This is why we are encouraging investors to be proactive. Whether moving from cash to maximize tax-free cash flow, or extending duration to capture greater total return as rates fall, the case for acting before the next leg down in rates begins, is an extremely compelling one, in our view.
Clinton Investment Management Update
We want to take this moment to sincerely thank our clients, advisors, and the institutions we serve, for their ongoing trust and loyalty. We are extremely proud and grateful that our municipal bond strategies have continued to deliver meaningful value to the clients and institutions over time. CIM has grown meaningfully over the past 12 months, as we made strategic investments in our team and continue to enhance our firm’s operational infrastructure. While we are enjoying our best year of growth since our firm’s founding, we are equally proud of our ability to attract and retain extremely talented and experienced professionals, at all levels of the firm. We are confident our expanded team will enhance and guide our firm’s growth, as well as our strategies, in the years ahead. We are deeply grateful for the trust that our clients have placed in us, which is evident in the growth of our assets under management (AUM). Our AUM are now approaching $3.5 billion, rising by over 100% since the end of 2022. Our differentiated Municipal Credit Opportunities strategy is now our firm’s largest strategy with AUM exceeding $2 billion, while our Market Duration strategy AUM has grown in excess of $1 billion.
Please do not hesitate to reach out to us with any questions regarding the differentiated strategies we offer or where we are seeing the best market opportunities going forward.
Best Regards,
Andrew Clinton
CEO
.
Please remember that past performance may not be indicative of future results. Net-of-fee performance returns are calculated by deducting the actual Clinton Investment Management, LLC investment management fee from the gross returns. Performance returns include the reinvestment of income and capital gains. Actual results may differ from the composite results depending upon the size of the account, investment objectives, guidelines and restrictions, inception of the account and other factors. Different types of investments involve varying degrees of risk, and there can be no assurance that the future performance of any specific investment, investment strategy, or product, made reference to directly or indirectly in this newsletter (article), will be profitable, equal any corresponding indicated historical performance level(s), or be suitable for your portfolio. Due to various factors, including changing market conditions, the content may no longer be reflective of current opinions or positions. Moreover, you should not assume that any discussion or information contained in this newsletter (article) serves as the receipt of, or as a substitute for, personalized investment advice from Clinton Investment Management, LLC. To the extent that a reader has any questions regarding the applicability of any specific issue discussed above to his/her individual situation, he/she is encouraged to consult with the professional advisor of his/her choosing. Please consult with an investment professional before making any investment using content or implied content from any investment manager. A copy of our current written disclosure statement discussing our advisory services and fees is available upon request.
The views and opinions expressed are not necessarily those of the distributing firm or any affiliates. Nothing discussed or suggested should be construed as permission to supersede or circumvent your firm’s policies, procedures, rules, and guidelines.
Personal Consumption Expenditures (PCE), the Fed’s preferred measure of inflation, has declined for 14 consecutive months providing further confidence that the path of inflation should continue to be lower.
US Real GDP growth has declined materially, falling by over -67% since the third quarter of last year.
US households are now carrying the highest levels of housing and non-housing debt in a generation.
The impact of diminished consumer spending can be seen in the meaningful slowing in retail sales over the past two months.
The -408,000 jobs that were lost last month, according to the May household survey, could be a harbinger of what the US economy is likely to face going forward.
Covid savings has been spent.
Investors with large allocations to preferred savings and cash, may be unaware of the significant reinvestment risk they are exposed to in these short duration instruments.
Municipal credit quality remains stable, and the muni curve remains steep providing an attractive opportunity to extend duration and pick up yield by increasing weightings to lower investment grade and below investment grade munis.
Financial markets have posed a number of vexing questions to investors over the past two years, not the least of which included the height to which interest rates could rise without negatively impacting US economic activity. The answer appears to now be evident. Recent economic data, see Figure 1, clearly illustrate that one of the fastest and most severe interest rate hiking cycles in history is having its desired negative impact on GDP growth. The meaningful moderation in economic activity we are now witnessing is, no doubt, guiding the Fed’s caution and ultimate decision to pause rate hikes, having now kept them on hold for over eight months.
During this time, US Real GDP growth has declined materially, falling by over -67% since the third quarter of last year. Although many market participants were surprised by the +4.9% GDP growth rate of Q3 of 2023, what was less surprising was that that growth could not be sustained. The extremely weak +1.3% GDP growth of the first quarter of 2024 is a clearer representation of the current state of the broader economy, in our view. The recent downturn also increases the risk that the US economy could dip into recession in the months ahead. Some might argue, and rightfully so, that there are still segments of strength in the US economy, such as areas of technology driven by the incredible speculative fervor surrounding Artificial Intelligence (AI). Yet, we are now seeing broad inflation and price moderation across every Fed region in the country, according to the Fed’s Beige Book. Moreover, since the economic reopening, following Covid, we have also heard much about the strength and “resilience” of the US consumer. On the contrary, we are now seeing clear signs US consumers are anything but healthy, as they are now carrying an enormous debt burden, just as their Covid savings have been depleted. Retail spending has decelerated while consumer credit card debt has exploded to levels above those prior to Covid. The difference this time is that the interest rates associated with that credit card debt is approaching 30%, placing an extraordinary burden on consumer balance sheets. US households are now carrying the highest levels of housing and non-housing debt in a generation, see Figure 2, while interest rates are among the highest many have seen in their lifetimes.
The impact of diminished consumer spending can be seen in the meaningful slowing in retail sales over the past two months. Further indications of the struggle US consumers are facing can be seen in the recent earnings weakness and forward guidance reported by consumer-discretionary companies, such as Starbucks, McDonalds, Target and Walmart, among others. Business profitability will be negatively impacted, unless businesses pivot to cutting expenses to preserve margins. Cost cutting will likely include employee layoffs at scale. For this reason, we believe the -408,000 jobs that were lost last month, according to the May household survey, could be a harbinger of what the US economy is likely to face going forward. As a result, we believe the unemployment rate will continue to rise as payrolls are further rationalized. This combination of increased job losses and weaker discretionary spending will likely lead to slower economic growth, placing further downward pressure on inflation.
For those who are concerned that inflation will remain stubbornly high for the foreseeable future, we would direct you to Figure 3, which should provide comfort as the Covid savings consumers accumulated has now been spent, leaving very little flexibility to endure further price increases.
It is also worth noting that Personal Consumption Expenditures (PCE), the Fed’s preferred measure of inflation, has declined for 14 consecutive months, providing further confidence that the path of inflation should continue to be lower. We believe that the inflation catalysts of supply chain disruptions and geopolitical strife will likely continue to diminish over time as well, resulting in the Fed being forced to cut rates. The Fed’s decision to pair back its Quantitative Tightening (QT) policy, provides further evidence that the FOMC believes financial conditions are too tight and increasingly are likely to take a toll on economic growth, without a proactive easing of rates soon.
Given the meaningful moderation in growth we are witnessing, we are compelled to draw attention to the risks investors face going forward, as we carefully consider the future direction of interest rates. While the Fed has indicated that rate cuts may not come for some time, they have all but promised us that they will eventually come. Therefore, we are of the belief that high quality fixed income can be expected to deliver attractive returns on a risk-adjusted basis going forward. Like no time in recent memory, we have become increasingly concerned about investors with large allocations to preferred savings and cash, as they may be unaware of the significant reinvestment risk they are exposed to in these short duration instruments. Were interest rates to fall as significantly as we expect, in the months and years ahead, the high cash flow and principal appreciation one could capture today may be lost.
Within our municipal bond strategies, we have begun extending durations to take advantage of the steep slope of the muni curve, which does not exist along the Treasury curve, to lock in higher yields, as we believe interest rates peaked in October of 2023. We are also seeking to better position client portfolios for the likely near-term decline in interest rates we expect, due to Fed forward guidance and Fed action over the coming months. Municipal credit quality remains stable, presenting the opportunity to increase weightings to lower investment grade, and below investment grade munis, for our Municipal Credit Opportunities strategy. Fundamental outlooks remain solid and stable providing an opportunity to capture higher yields without materially increasing investor risk exposures.
We are comforted by our firm belief that our strategies and client portfolios are well positioned for what the future holds. Municipal credit quality remains extremely solid as upgrades continue to outnumber downgrades by a meaningful margin. When one considers the dramatically lower default rates of municipal bonds relative to corporates, the risk-adjusted returns munis deliver are even more compelling, in our view. While we expect the months ahead to be increasingly uncertain, we also expect our strategies to remain a source of stability and enhanced tax-free cash flow for years to come.
If you should have any questions about our strategies, the content in this commentary, or the municipal bond market more broadly, please do not hesitate to reach out. We would be happy to address any questions you may have.
Best Regards,
Andrew Clinton
CEO
Please remember that past performance may not be indicative of future results. Net-of-fee performance returns are calculated by deducting the actual Clinton Investment Management, LLC investment management fee from the gross returns. Performance returns include the reinvestment of income and capital gains. Actual results may differ from the composite results depending upon the size of the account, investment objectives, guidelines and restrictions, inception of the account and other factors. Different types of investments involve varying degrees of risk, and there can be no assurance that the future performance of any specific investment, investment strategy, or product, made reference to directly or indirectly in this newsletter (article), will be profitable, equal any corresponding indicated historical performance level(s), or be suitable for your portfolio. Due to various factors, including changing market conditions, the content may no longer be reflective of current opinions or positions. Moreover, you should not assume that any discussion or information contained in this newsletter (article) serves as the receipt of, or as a substitute for, personalized investment advice from Clinton Investment Management, LLC. To the extent that a reader has any questions regarding the applicability of any specific issue discussed above to his/her individual situation, he/she is encouraged to consult with the professional advisor of his/her choosing. Please consult with an investment professional before making any investment using content or implied content from any investment manager. A copy of our current written disclosure statement discussing our advisory services and fees is available upon request.
The views and opinions expressed are not necessarily those of the distributing firm or any affiliates. Nothing discussed or suggested should be construed as permission to supersede or circumvent your firm’s policies, procedures, rules, and guidelines.
The reinvestment rate risk and opportunity cost associated with cash and cash equivalent investments, can be extremely high if one is sub-optimally positioned.
Wall Street economists’ and strategists’ fears that higher interest rates would be sustained “for longer”, were overstated by orders of magnitude.
Our Credit Opportunities composite returned +7.52%, net-of-fees, while our intermediate Market Duration composite returned +6.33%, net-of-fees.
Three and five-year areas of the muni curve were among the worst performers, returning +3.46% and +4.31% respectively in 2023.
Those able to look past the next few months, will likely be well-served, as interest rates are expected to be materially lower in the years ahead.
We have now seen the largest drop in the recorded history of the Federal government’s New Tenant Rent Index.
For those investors who remain underweight fixed income, and munis in particular, who may be concerned that they may have missed the peak in rates, we have some good news. The average, cumulative magnitude of rate cuts, during every prior Fed easing cycle, is roughly 500 basis points.
Investor inflows into Clinton Investment’s strategies in 2023 exceeded $900 million.
We are very proud to have been selected by MassMutual Investments to sub-advise three new open-end municipal bond funds that will be managed consistent with our Short, Market Duration, and Credit Opportunities strategies.
We received confirmation, in the fourth quarter of 2023, that the powerful inflationary impulse that had plagued the US economy, for the prior eighteen months, was indeed transitory after all. We also learned that the views expressed by Wall Street economists and strategists, fearing that higher interest rates would be sustained “for longer,” were overstated by orders of magnitude. The error in their position is evidenced by the extremely attractive total returns fixed income delivered in 2023. The broader market appeared to have concluded that the Fed would continue to steadily raise rates throughout 2023, as ten-year Treasury bond yields surged toward 5.00%. The well-worn narrative of “higher for longer” had become so pervasive in the media and across major financial services companies, that many investors were caught offside when the Fed unexpectedly pivoted, which resulted in a powerful bond rally, as investors repositioned portfolios for the new, expected lower rate regime.
Clinton Investment Management (CIM) clients and readers have known, for many months, that not only was inflation moderating, but they were also aware of our expectations that the Fed was more likely to begin cutting interest rates, rather than raise rates further. Few shared our outlook, just a few months ago. It appears the broader market is now solidly in line with our views. The confidence we had in our conviction benefited our client portfolios accordingly. We are, therefore, deeply grateful that our clients and strategies were well positioned for the powerful decline in yields and rally in bond prices that we witnessed in the fourth quarter, as the Fed pivoted from a tightening bias to a pause. Our client portfolios fully participated in the bond rally and the outperformance of the municipal bond sector, in particular, as we delivered absolute and relative returns that were amongst the highest in our firm’s history. Our Credit Opportunities composite returned +7.52%, net-of-fees, while our intermediate Market Duration composite returned +6.33%, net-of-fees. For those in the highest tax brackets, the taxable equivalent returns we delivered were meaningfully higher. Municipal bonds in the three and five-year areas of the muni curve were among the worst performers, returning +3.46% and +4.31% respectively in 2023, according to Bloomberg. The fourth quarter served as a painful reminder, to the underinvested, that the reinvestment rate risk and opportunity cost associated with cash and cash equivalent investments, can be extremely high if one is sub-optimally positioned. To this point, while short-term rates rose to the highest levels in over a decade, we have been imploring investors, for many months, to consider the likely fleeting nature of these higher yields. We now know, from the Fed’s recent meeting and corresponding commentary, that not only is the Fed likely finished raising rates, but they are, in our view, also going to be cutting rates by a meaningful degree, in the months ahead. While there is uncertainty regarding the exact timing of when these rates cuts might begin, we believe that the outcome is undeniable. Therefore, those able to look past the next few months, will likely be well-served, as interest rates are expected to be materially lower in the years ahead.
The harsh reality investors now face is that the extremely attractive yields investors have enjoyed in cash and cash equivalent securities will likely materially decline going forward. For investors concerned that inflation may remain stubbornly high, keeping rates aloft, we encourage them to consider the components of Consumer Price Index (CPI) that are currently overstating the level of inflation, including Owner’s Equivalent Rent (OER)/Shelter. For example, if OER accurately reflected current, as opposed to lagging, rental renewals, the CPI would already be below the Fed’s 2% target, according to recent comments from Campbell Harvey, Professor of Finance Duke University. We have also seen the largest drop in the recorded history of the Federal government’s New Tenant Rent Index, indicating to us that further material declines in OER and inflation should be expected in the months ahead (see Figure 1).
Figure 1
Moreover, the real-time CPI data implies that the current level of real interest rates are substantially restrictive. They are now approaching the roughly 2.4% real rates that persisted during the Great Financial Crisis, when accounting for real-time data. We believe this reality is the primary motivation behind the Fed’s decision to rapidly pivot to an easing posture.
As we consider the outlook for municipal bonds in this environment, we see strong demand for the tax-free cash flow that munis offer persisting over time. This is evident in the asset class’s recent outperformance relative to Treasuries and corporate bonds. While some have pointed to lower ‘AAA’ muni yields, compared to Treasuries, as an indication that the asset class has richened on a relative basis, we would like to remind investors that we have been recommending an underweight position to ‘AAA’ rated munis for some time. Yields available on ‘AA’, ‘A’, and ‘BBB’ rated munis remain extremely compelling, on a taxable equivalent basis, in our view, especially for those in the highest tax brackets. We continue to overweight ‘A’ and ‘BBB’ rated bonds in our client portfolios, as a result. The municipal bond yield curve also remains meaningfully inverted from 2 to 13 years, while the curve from 2 to 30 years remains positively sloped by over 80 basis points, at the time of this writing. The municipal yield curve’s persistent dislocation from the inverted Treasury curve continues to present investors with an excellent opportunity to reposition their holdings away from low yielding, short and intermediate maturities, where many investors are over exposed, while reallocating to the highest yield and structurally mispriced longer duration areas of the muni curve. We believe longer duration munis will continue to outperform in 2024, as they did in 2023. Now that the Fed has indicated their rate hiking cycle is over, they will likely be cutting short-term yields in the future, which should benefit longer duration securities from a total return perspective. It is also worth noting that our outlook for municipal credit quality remains constructive. Record rainy-day and general fund balances buffer our long-held view that municipalities have substantial cash reserves sufficient to ride out a slowing economic environment in the future.
In summary, our outlook for the future direction of interest rates is guided by the dramatic decline in interest rates we have witnessed since their peak in the fall of 2023. We must also consider the potential for further rate declines and the cumulative degree to which rates can fall. For those investors who remain underweight fixed income, and munis in particular, and who may be concerned that they have missed the peak in rates, we have some good news. The average, cumulative magnitude of rate cuts, during every prior Fed easing cycle, is 500 basis points. Given the Treasury market has only priced in roughly 100 basis points of cuts to-date, we believe there is considerably more room for rates to fall from here. Therefore, investors waiting for an attractive entry point into fixed income should act expeditiously as the current levels of yields may not be around much longer.
CIM Firm Update
Not only did our clients enjoy one of our firm’s best years, from a performance perspective, but our firm also celebrated our strongest year of growth since our founding in 2007, both in terms of new members of our team as well as growth in assets under management (AUM). Investor inflows into our strategies in 2023 exceeded $900 million, while we welcomed a new General Counsel, Lane Bucklan, a new Director of Research, Shivani Singh, and a new Business Development Associate, Sean Coffey. We are also very proud to have been selected by MassMutual Investments to sub-advise three new open-end municipal bond funds that will be managed consistent with our Short, Market Duration, and Credit Opportunities strategies. We are particularly proud of this achievement given the thorough nature of MassMutual’s granular, industrywide muni manager search. We believe our selection is a clear illustration of the consistency with which we have delivered meaningful value to our clients, over time, together with the rigor of our risk management culture.
If you should have any questions regarding where we are seeing the best value and opportunities in the municipal bond market today, please do not hesitate to reach out to us directly.
Best Regards,
Andrew Clinton
CEO
Please remember that past performance may not be indicative of future results. Net-of-fee performance returns are calculated by deducting the actual Clinton Investment Management, LLC investment management fee from the gross returns. Performance returns include the reinvestment of income and capital gains. Actual results may differ from the composite results depending upon the size of the account, investment objectives, guidelines and restrictions, inception of the account and other factors. Different types of investments involve varying degrees of risk, and there can be no assurance that the future performance of any specific investment, investment strategy, or product, made reference to directly or indirectly in this newsletter (article), will be profitable, equal any corresponding indicated historical performance level(s), or be suitable for your portfolio. Due to various factors, including changing market conditions, the content may no longer be reflective of current opinions or positions. Moreover, you should not assume that any discussion or information contained in this newsletter (article) serves as the receipt of, or as a substitute for, personalized investment advice from Clinton Investment Management, LLC. To the extent that a reader has any questions regarding the applicability of any specific issue discussed above to his/her individual situation, he/she is encouraged to consult with the professional advisor of his/her choosing. Please consult with an investment professional before making any investment using content or implied content from any investment manager. A copy of our current written disclosure statement discussing our advisory services and fees is available upon request.
The views and opinions expressed are not necessarily those of the distributing firm or any affiliates. Nothing discussed or suggested should be construed as permission to supersede or circumvent your firm’s policies, procedures, rules, and guidelines.
In November fixed income markets and municipal bonds in particular experienced the best monthly return since 19821. Clinton Investment Management’s Market Duration and Municipal Credit Opportunities strategies enjoyed their best monthly performance in our firm’s history2. Positive bond market momentum has carried into December as well.
Where are rates headed?
Five consecutive months of declining durable goods prices, including furniture, used cars and appliances is evidence of deflation. Airfares are down over 15% year-over-year according to the most recent CPI data.
20 consecutive months of declining leading economic indicators have historically been correlated with recession 100% of the time.
Declines in inflation to the degree we have seen have been historically correlated with recession 100% of the time.
Increases in joblessness to the degree the Fed is forecasting has been historically correlated with recession 100% of the time.
Oil is in a bear market, down over 20% from its high in September despite OPEC supply cuts and war in the Middle East.
CPI 3.2%, ex lagging shelter, is actually 1.5%-1.8% today…Rosenberg Research believes inflation could be 0% by the end of 2024.
Fed historically cuts rates 10 months following Fed pause on average, interest rates move prior to cuts.
Walmart has stated that its outlook for the food and goods industry is heading into a period of deflation.
The Fed has historically cut 500 bps, on average, during prior easing cycles.
What should investors do now?
Act expeditiously, as it is better to be early rather than late to reduce the risk of missing further declines in rates.
Where are the best opportunities in Munis today?
The muni curve is positively sloped by 0.83% or 83 basis points 2s/30s while the muni curve is inverted by -26bps 2’s/10’s, a dislocation from the inverted Treasury curve and an indication of the relative richness and likelihood of future underperformance of short-intermediate maturities in the muni market.
Moody’s municipal default study demonstrates the higher risk-adjusted yield/return in lower investment grade bonds presents opportunity to investors with longer-term investment horizons, seeking to maximize tax-free cash flow and total return over time.
There may be a significant opportunity to increase portfolio tax efficiency through active tax loss/gain harvesting strategies heading into 2024 remains.
Endnotes
Clinton Investment Management, LLC (“CIM”) is registered as an investment adviser with the US Securities and Exchange Commission under the Investment Adviser’s Act of 1940. CIM headquarters is located at 201 Broad Street, 8th Floor, Stamford, CT 06901.
Please refer to clintoninvestment.com for CIM’s most recent performance data.
Data referenced may have been obtained from a variety of sources sources, including, but not limited to, Bloomberg, CreditScope or other systems and programs. CIM makes no representation concerning the accuracy of information received from any third party.
Past performance may not be indicative of future results. There can be no assurance that the future performance of any specific investment, investment strategy, or product, made reference to directly or indirectly in this market brief, will be profitable, equal any corresponding indicated historical performance level(s), or be suitable for your portfolio. The information contained herein is not intended as an offer or solicitation for the purchase or sale of any securities. High grade and high yield securities which may be mentioned herein may not be suitable for all investors. A credit rating of a security is not a recommendation to buy, sell or hold securities and may be subject to revisions, including reductions or withdrawals, at any time by the rating agency.
Interest on municipal bonds is generally exempt from federal taxation and may also be free of state and local taxes for investors residing in the state and/or locality where the bonds were issued. However, some municipal bonds may be subject to federal alternative minimum tax (AMT). Municipal bonds are subject to capital gain or losses if they are sold prior to maturity.
There is no assurance any of the market trends or forecasts mentioned will continue or occur and any estimates or opinions offered are subject to change without notice. Any statements pertaining to market trends are based on current market conditions and any future market conditions will always remain uncertain. You should not assume that any discussion or information contained in this market brief serves as the receipt of, or as a substitute for, personalized investment advice and you should therefore consult with an investment professional before making any investment using the content, either express or implied, of the information provided. This information should not replace your consultation with a financial professional regarding your tax situation. CIM is not a tax advisor.
A copy of our current written disclosure statement discussing our advisory services and fees is available for review upon request.
Please remember that past performance may not be indicative of future results. Different types of investments involve varying degrees of risk, and there can be no assurance that the future performance of any specific investment, investment strategy, or product, made reference to directly or indirectly in this newsletter (article), will be profitable, equal any corresponding indicated historical performance level(s), or be suitable for your portfolio. Due to various factors, including changing market conditions, the content may no longer be reflective of current opinions or positions. Moreover, you should not assume that any discussion or information contained in this newsletter (article) serves as the receipt of, or as a substitute for, personalized investment advice from Clinton Investment Management, LLC. To the extent that a reader has any questions regarding the applicability of any specific issue discussed above to his/her individual situation, he/she is encouraged to consult with the professional advisor of his/her choosing. Please consult with an investment professional before making any investment using content or implied content from any investment manager. A copy of our current written disclosure statement discussing our advisory services and fees is available for review upon request.
Based on Market Duration Strategy composite monthly performance with an inception date of May 31, 2017 and Municipal Credit Opportunities Strategy composite monthly performance with an inception date of September 30, 2014. ↩︎
5% rates on T-Bills, taxable money market funds, and short-term cash instruments may appear attractive to investors today, however, we are reminded that those yields are almost 50% below the yields investors in the highest tax-brackets can achieve in longer duration tax-free municipal bonds, on a taxable equivalent basis.
If investors are sufficiently confused by these seemingly contradictory Fed actions and statements, they have a lot of company.
If we consider what home prices and rent renewals are actually doing today, as opposed to several months ago, we would find that home prices and apartment rental rate increases are barely above zero, according to Cambell Harvey, Professor at Duke University.
There have been very few occasions, over the past 20 years, when investors could achieve taxable fixed income yields over 5%, or taxable equivalent yields in tax-free municipal bonds, for those in the highest tax bracket, approaching 10%.
Since 1980, back-to-back years of negative returns of municipal bonds have only occurred once in 1980 and 1981. Yet, the following year, in 1982, the Bloomberg Barclays Municipal Bond Index returned over +40%
The tumult with which financial markets closed the third quarter understandably caught many investors by surprise. While markets began the quarter on stable footing, meaningful declines in public equity markets, together with substantial increases in bond yields, and a corresponding decline in bond prices caused an abrupt and meaningful drawdown in asset values, across asset classes. The Fed paused its rate hiking cycle for the third time in four meetings, indicating concerns that the Fed may have tightened financial conditions too far. Yet, simultaneously, the Fed’s Statement of Economic Conditions (SEP) indicated the Fed was leaving the door open to further rate increases in the future. This is referred to as a “hawkish pause”. The Federal Open Market Committee also removed two rate increases from their 2024 SEP projections in September, suggesting that the Fed believes they will be able to achieve a soft economic landing, avoiding recession, despite having raised interest rates on a trajectory that is among the fastest in US history. If investors are sufficiently confused by these seemingly contradictory Fed actions and statements, they have a lot of company. As professional managers, we too are seeking to navigate the shifting crosscurrents created by the Fed and the corresponding economic impact. The current conflict between market narratives only adds to investor uncertainty.
The contradiction of the Fed’s actions serves to increase market volatility more broadly, challenging one’s ability to divine broad market direction. For example, if the Fed truly believed that inflation remains too high, the job market remains strong, the consumer remains resilient, and the economy is stable, as the recent GDP data have indicated, then why would the Fed be pausing rate hikes for the third time in four meetings? If the Fed truly believed its own statements, one would presume that the Fed would be raising rates much faster and higher, especially if the outcome the Fed fears most, higher inflation, was its base case. We place more emphasis on what action the Fed takes as opposed to what it states through its forward guidance. The Fed’s own economic projections have proven to be horribly inaccurate over time and should not be assumed as fact, in our view. As fixed income investors, we endeavor to look past conflicting statements, seeking greater clarity through the application of deep economic and market research to help guide us on a conservative path that we believe will enable us to navigate challenging market conditions, while remaining focused on our client’s’ long-term investment objectives and risk tolerance.
In this moment, we are reminded that inflation and credit exposure are the greatest risk to long-term fixed income investors. Therefore, investors can take confidence that the future truly is brighter for bond holders, in our view. Inflation has declined markedly from the over 9% Consumer Price Index (CPI) levels that shocked markets in the summer of 2022. The Fed’s 2% inflation target is now within view, given that CPI has declined by almost 70% from its peak. The better news is that the shelter component of CPI, representing roughly one third of the index, was up 7% for September. At first, that may seem concerning, however, Owner’s Equivalent Rent (OER) is a meaningfully lagging indicator. For example, if we consider what home prices and rent renewals are actually doing today, as opposed to several months ago, we would find that home prices and apartment rental rate increases are barely above zero, according to Cambell Harvey, Professor at Duke University, who authored a seminal research paper which identified the positive correlation between the inverted Treasury yield curve and the onset of US recessions, Yield Curve Inversions and Future Economic Growth, May 2008.
Harvey recently noted that, when shelter/OER increases more accurately reflect current market conditions of 1% to 2%, and are substituted into CPI, as opposed to September’s 7% rate, inflation is actually between +1.5% to +2%, in line with the Fed’s stated 2% target. Is it possible that the reason the Fed has paused rate hikes twice in the last three meetings, and is likely to pause for a third time this week, is because they know what we know, that is that the lagged impact of shelter on CPI, will likely result in inflation falling back to the Fed’s goal in the months ahead? Moreover, when we consider that as inflation falls and credit conditions tighten further, due to accelerating real rates, currently at 2.5%, the highest they have been since the Great Financial Crisis, the economy will likely slow much faster. The question remains, what is an investor to do?
Our recommendation to investors is to refocus on long-term investment horizons and objectives while taking from the market what it offers investors today, which are historically high yields. First and foremost, we can definitively state that there have been very few occasions, over the past 20 years, when investors could achieve taxable fixed income yields over 5%, or taxable equivalent yields in tax-free municipal bonds, for those in the highest tax bracket, approaching 10%. See Figure 1 below.
Figure 1
We are now in an environment where high-net-worth investors may be positioned to achieve returns similar to those of the broad equity indices, in the months and years ahead, due to the very attractive tax-free cash flow that municipal bonds deliver, while also enjoying substantially lower standard deviations of returns and lower risk of a 50% drawdown that often accompanies public equity markets, every 10 years or so.
While 5% rates on T-Bills, taxable money market funds, and short-term cash instruments may appear attractive to investors today, however, we are reminded that those yields are almost 50% below the yields investors in the highest tax-brackets can achieve in longer duration tax-free municipal bonds, on a taxable equivalent basis. In addition, given that short-term rates are variable over time, should interest rates fall, investors with large cash positions will be forced to reinvest at substantially lower yields in the future.
While it may not be much comfort to fixed income investors, it is important to note that municipal bonds continue to outperform taxable bonds, year-to-date, falling less in value than their taxable counterparts. Municipal bonds are once again illustrating the stabilizing force they provide, in an investors’ broader asset allocation, especially during difficult market conditions. In our view, municipal bond credit quality remains the strongest it has been in over 30 years, due in large part to record general fund and rainy-day fund balances, as well as the hundreds of billions of dollars they received from President Biden’s American Rescue Plan. We expect the hundreds of billions in cash that municipalities currently hold on their balance sheets will serve to keep municipal credit quality stable as the economy slows in the months to come.
Figure 2
As you can see in Figure 2 above, since 1980, back-to-back years of negative returns of municipal bonds have only occurred once in 1980 and 1981. Yet, the following year, in 1982, the Bloomberg Barclays Municipal Bond Index returned over +40%. We, therefore, are encouraging investors to stay the course, while seeking opportunities to add to their municipal bond positions, as the Fed’s hiking cycle may already have come to a close, meaning the next action by the Fed may actually be a rate cut. Rate cuts have occurred, on average, roughly eight months following a Fed pause, over the history of rate hiking cycles. If you share our view that it is reasonable to expect this outcome once again, interest rates are likely to be materially lower in months ahead. Fixed income investors able to take advantage of the opportunities that persist today, are likely to be well compensated for their courage and patience as economic outcomes unfold in the months and years ahead.
If you should have any questions about this commentary or the municipal bond market more broadly, please let us know.
Best Regards,
Andrew Clinton
CEO
Please remember that past performance may not be indicative of future results. Different types of investments involve varying degrees of risk, and there can be no assurance that the future performance of any specific investment, investment strategy, or product, made reference to directly or indirectly in this newsletter (article), will be profitable, equal any corresponding indicated historical performance level(s), or be suitable for your portfolio. Due to various factors, including changing market conditions, the content may no longer be reflective of current opinions or positions. Moreover, you should not assume that any discussion or information contained in this newsletter (article) serves as the receipt of, or as a substitute for, personalized investment advice from Clinton Investment Management, LLC. To the extent that a reader has any questions regarding the applicability of any specific issue discussed above to his/her individual situation, he/she is encouraged to consult with the professional advisor of his/her choosing. Please consult with an investment professional before making any investment using content or implied content from any investment manager. A copy of our current written disclosure statement discussing our advisory services and fees is available for review upon request.
The views and opinions expressed are not necessarily those of the distributing firm or any affiliates. Nothing discussed or suggested should be construed as permission to supersede or circumvent your firm’s policies, procedures, rules, and guidelines.
Please remember that past performance may not be indicative of future results. Different types of investments involve varying degrees of risk, and there can be no assurance that the future performance of any specific investment, investment strategy, or product,madereference to directly or indirectly in this newsletter (article), will be profitable, equal any corresponding indicated historical performance level(s), or be suitable for your portfolio. Due to various factors, including changing market conditions, the content may no longer be reflective of current opinions or positions. Moreover, you should not assume that any discussion or information contained in this newsletter (article) serves as the receipt of, or as a substitute for, personalized investment advice from Clinton Investment Management, LLC. To the extent that a reader has any questions regarding the applicability of any specific issue discussed above to his/her individual situation, he/she is encouraged to consult with the professional advisor of his/her choosing. The PSN universes were created using the information collected through the PSN investment manager questionnaire and use only gross-of-fee returns. The PSN/Informa content is intended for use by qualified investment professionals.Please consult with an investment professional before making any investment using content or implied content from any investment manager. A copy of our current written disclosure statement discussing our advisory services and fees is available for reviewupon request.
Over the last 8 Fed rate hiking cycles, the average return of the 10-year Treasury bond, over the 12 months following a Fed pause is +18.00%, while the average return of the 30-year Treasury Bond is +28.00% over the same period, according to Rosenberg Research.
Inflation has declined by more than 67%, in less than a year, and is now just 1% above the Fed’s long-term target of 2.00%. Owners’ Equivalent Rent, which represents roughly a third of CPI, is expected to fall meaningfully in the months ahead.
San Francisco Fed research, recently released, indicates the US housing market is likely to be experiencing deflation in 2024.
The June Non-Farm Payroll (NFP) number was the weakest jobs report since December of 2020, when the US lost over 200,000 jobs following the COVID crisis. July NFP of 187k was also below expectations while August was the third consecutive month below 200k jobs created.
The muni yield curve is positively sloped by over 0.60% or 60 basis points 2s/30s, according to Thompson Municipal Market Data, while the Treasury curve is inverted by 0.60% or 60 bps. The muni curve remains inverted between 2-year bonds and 13-year bonds, making the intermediate area of the curve unattractive from a total return perspective, over the next 12 months.
Extending duration to lock in higher yields, while implementing a barbell position as it relates to one’s duration exposure, is optimal in our view.
For those in the highest tax brackets, investors can achieve equity-like returns, on a taxable equivalent basis, in longer duration munis, given the high tax-free yield munis now offer. An added benefit is the risk of the 40% drawdown that is typically associated with public equities, every decade or so, is extremely unlikely in the municipal bond market, in our view.
Additional Insights
August 30, 2023
Clinton Investment Management, CEO and founder Andrew Clinton joined Bloomberg Intelligence’s Eric Kazatsky and Karen Altamirano on the FICC Focus weekly podcast on fixed income, credit, currencies, and commodities. In this episode—”Active Management, Fixed Income Chaos: Masters of the Muniverse”—they discuss the muni market, expectations around recession, and general outlook post-Jackson Hole and for the fourth quarter ahead.
Please remember that past performance may not be indicative of future results. Different types of investments involve varying degrees of risk, and there can be no assurance that the future performance of any specific investment, investment strategy, or product, made reference to directly or indirectly in this newsletter (article), will be profitable, equal any corresponding indicated historical performance level(s), or be suitable for your portfolio. Due to various factors, including changing market conditions, the content may no longer be reflective of current opinions or positions. Moreover, you should not assume that any discussion or information contained in this newsletter (article) serves as the receipt of, or as a substitute for, personalized investment advice from Clinton Investment Management, LLC. To the extent that a reader has any questions regarding the applicability of any specific issue discussed above to his/her individual situation, he/she is encouraged to consult with the professional advisor of his/her choosing. Please consult with an investment professional before making any investment using content or implied content from any investment manager. A copy of our current written disclosure statement discussing our advisory services and fees is available for review upon request.